03/02/2021
“We’re all in this together” has become a rallying cry during the coronavirus pandemic. While it is true that COVID-19 has affected everyone in some way, the magnitude and nature of the impact has been anything but universal. Evidence to date suggests that black and Hispanic workers face much more economic and health insecurity from COVID-19 than white workers.
Although the current strain of the coronavirus is one that humans have never experienced before, the disparate racial impact of the virus is deeply rooted in historic and ongoing social and economic injustices. Persistent racial disparities in health status, access to health care, wealth, employment, wages, housing, income, and poverty all contribute to greater susceptibility to the virus—both economically and physically.
Though black and brown communities share many of the experiences that make them more susceptible, there are also important differences between these communities that need to be understood in order to effectively combat the adverse economic and health effects of the virus. This report, focused specifically on black workers, is the first in a series that will explore how racial and economic inequality leave workers of color with few good options for protecting both their health and economic well-being. A companion report highlights conditions for Hispanic workers.
There are three main groups of workers in the COVID-19 economy: those who have lost their jobs and face economic insecurity, those who are classified as essential workers and face health insecurity as a result, and those who are able to continue working from the safety of their homes. Unfortunately, black workers are less likely to be found in the last group. They have suffered record numbers of job losses over the last two months (March 2020–May 2020), along with the ensuing related economic devastation. They also are disproportionately found among the essential workers in the economy today—continuing to go to their workplaces, risking their health and that of their families because they are unable to sustain adequate social distance from their co-workers and customers.
The labor market has continued to deteriorate, as evidenced by massive numbers of unemployment insurance claims through the middle of May (Shierholz 2020). As of May 16, nearly one in four workers have applied for unemployment insurance benefits, either in the regular program or through the new Pandemic Unemployment Assistance program, since stay-at-home orders first went into effect. Furthermore, in the first month of job losses, for every 100 workers who were able to file for UI, 37 additional workers tried to apply but could not get through the system to make a claim (Zipperer and Gould 2020). While many of those who initially couldn’t get through have likely been able to in subsequent weeks, it is also likely that would-be applicants face ongoing challenges and that the reported number of applicants understates the magnitude of the problem.
The latest national data available to assess the impact of job losses for black and white workers separately is the Current Population Survey for April 2020. The labor market started deteriorating in March but fell off a cliff in April. While the losses have certainly continued, the April data gives us a first look at how black and white workers are faring.
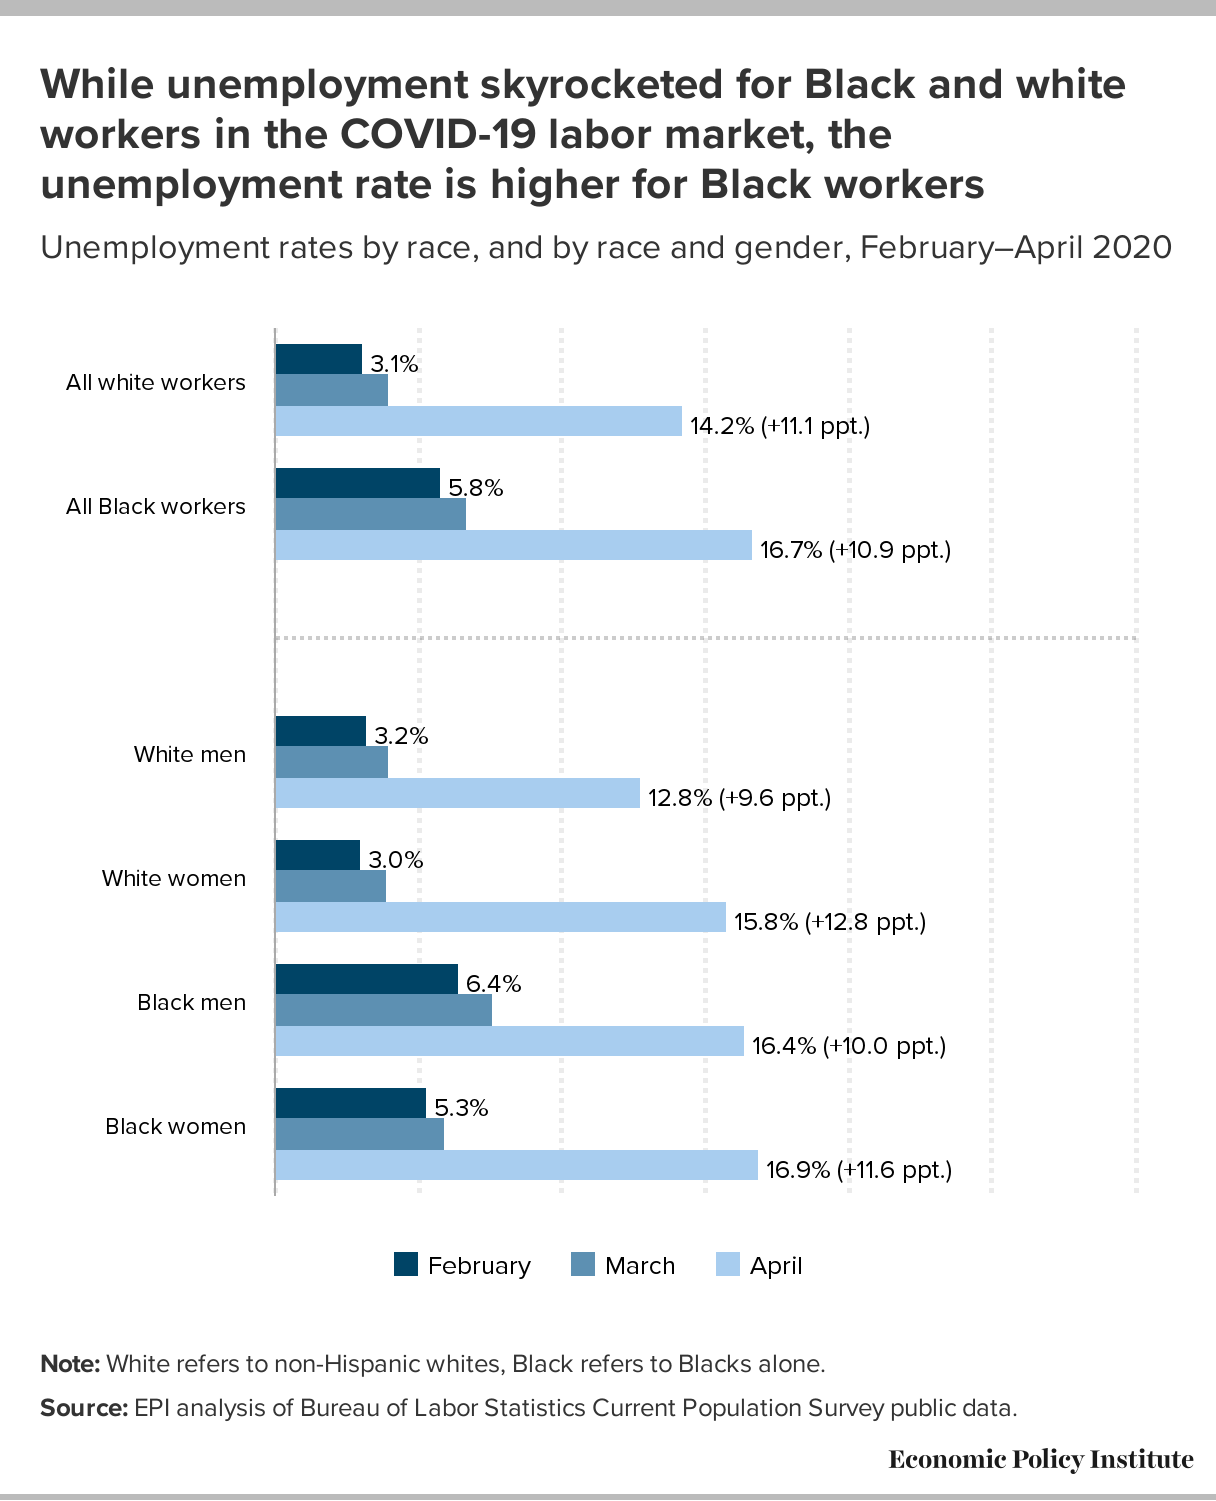
Figure A shows the unemployment rates for white and black workers in February, March, and April of this year. February provides a benchmark for the pre-pandemic economy. As will be described in greater detail later, the black unemployment rate has, even in the tightest of labor markets, been persistently and significantly higher than the white unemployment rate. Both began rising in March and then skyrocketed in April. As of the latest data, the black unemployment rate is 16.7%, compared with a white unemployment rate of 14.2%.
And while these differences are notable, they mask even greater disparities that are apparent when we look at unemployment rates by race and gender. White men experienced a large, but relatively smaller, rise in unemployment. Still, the white male unemployment rate is now higher than the highest point the overall unemployment rate reached in the depths of the Great Recession (10.0%, in October 2009; see EPI 2020). White women experienced the largest increase in unemployment, while black women now have the highest unemployment rate of the four groups analyzed. (It should be noted that across race, gender, and ethnicity, Hispanic women actually have the highest unemployment rate as of April 2020—about one in five Latina workers are unemployed. Further data on Hispanic workers will be provided in a forthcoming report.)
FIGURE A
| February | March | April | |
|---|---|---|---|
| All white workers | 3.1% | 4.0% | 14.2% |
| All Black workers | 5.8% | 6.7% | 16.7% |
| White men | 3.2% | 4.0% | 12.8% |
| White women | 3.0% | 3.9% | 15.8% |
| Black men | 6.4% | 7.6% | 16.4% |
| Black women | 5.3% | 5.9% | 16.9% |
14.2% (+11.1 ppt.)16.7% (+10.9 ppt.)12.8% (+9.6 ppt.)15.8% (+12.8 ppt.)16.4% (+10.0 ppt.)16.9% (+11.6 ppt.)3.1%5.8%3.2%3.0%6.4%5.3%FebruaryMarchAprilAll white workersAll Black workersWhite menWhite womenBlack menBlack women
Note: White refers to non-Hispanic whites, Black refers to Blacks alone.
Source: EPI analysis of Bureau of Labor Statistics Current Population Survey public data.
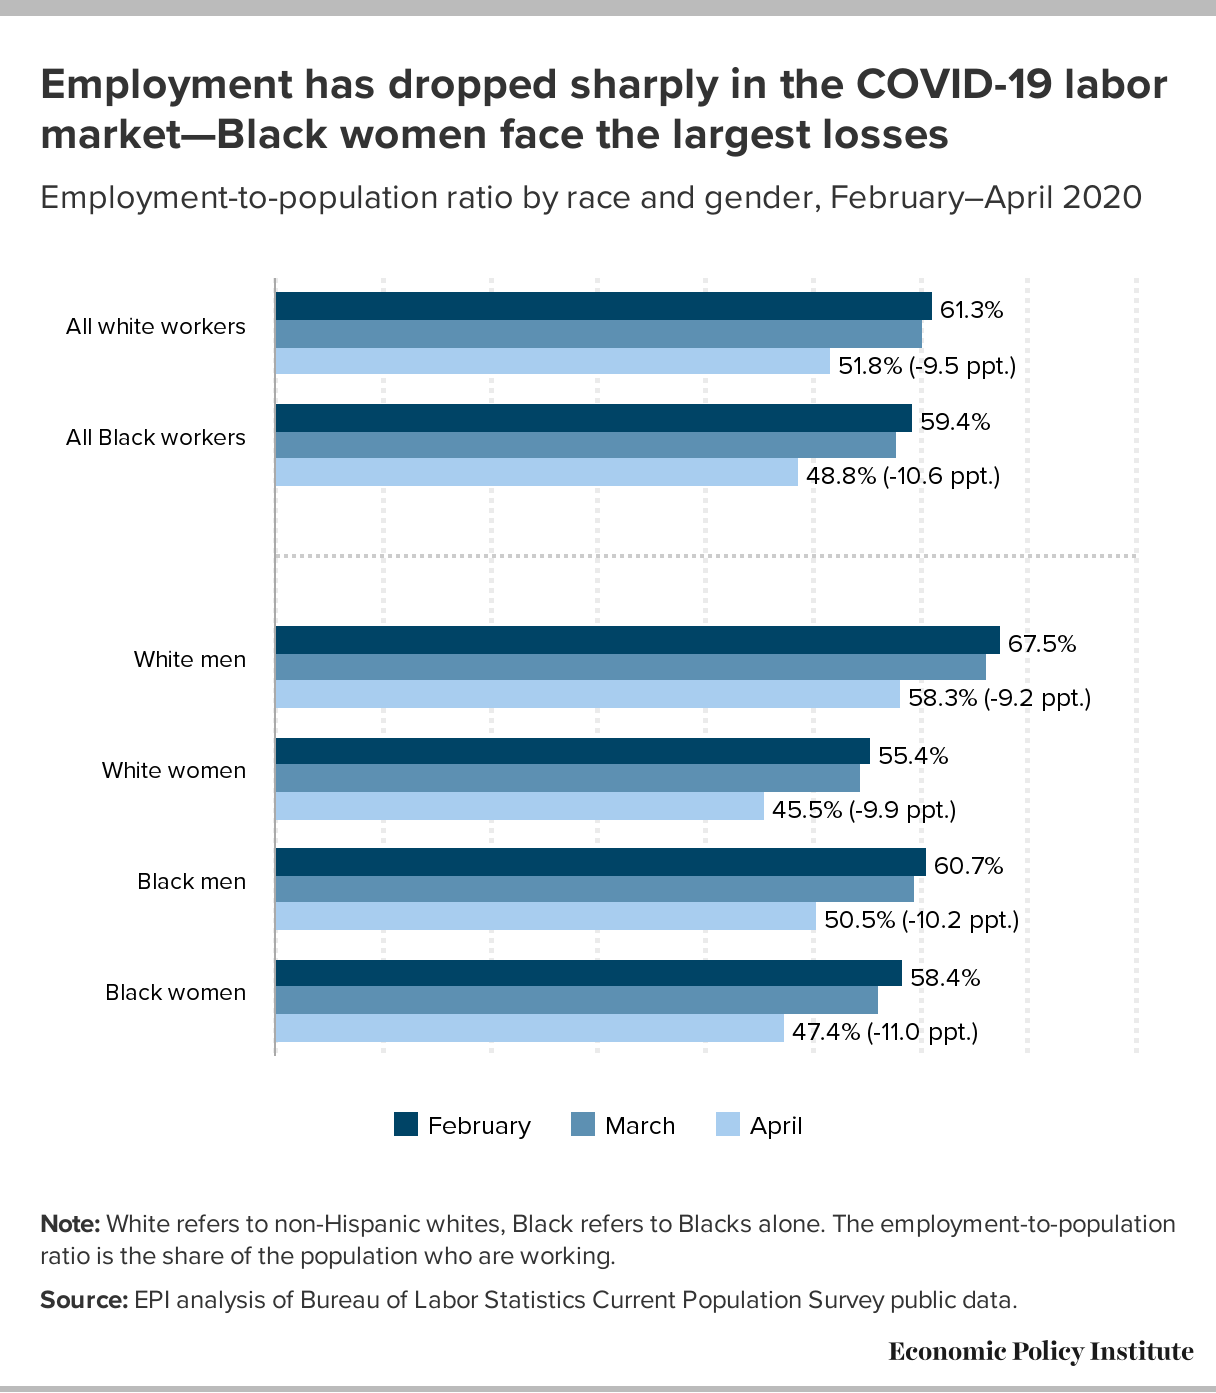
The unemployment rate is a commonly used measure of labor market slack. One limitation, however, is that it relies on would-be workers to either be on temporary layoff or have looked for work in the last four weeks to be counted as unemployed. In this economy, with the health requirements to stay home and with sectors being completely decimated, it is likely that many would-be workers are not actively looking for work and therefore would not be counted in the official unemployment rate. For this reason, policymakers should look to other measures to determine when to turn on and off policy triggers to support workers and the economy (Gould 2020b). One such measure is the employment-to-population ratio (EPOP), or the share of the population with a job. Figure B displays the EPOP for the same groups shown in Figure A.
Employment losses were stark across racial lines between February and April. Black workers saw slightly greater losses in employment than white workers (10.6 vs. 9.5 percentage-point losses). This translates into an employment loss of 17.8% among black workers and 15.5% among white workers. More than one in six black workers lost their jobs between February and April. As of April, less than half of the adult black population was employed. While the economic devastation is widespread, as we show in this report, black workers are less able to weather such a storm because they have fewer earners in their families, lower incomes, and lower liquid wealth than white workers.
As with the unemployment rates, women suffered greater job losses than men. Black women experienced a drop in their EPOP of 11.0 percentage points. Put another way, 18.8% of black women workers lost their jobs between February and April. At 45.5%, white women haven’t seen such a low share of the population with a job since the late 1970s, when white women were still increasing their participation in the labor market in general.
FIGURE B
| February | March | April | |
|---|---|---|---|
| All white workers | 61.3% | 60.2 | 51.8 |
| All Black workers | 59.4 | 57.8 | 48.8 |
| White men | 67.5 | 66.2 | 58.3 |
| White women | 55.4 | 54.5 | 45.5 |
| Black men | 60.7 | 59.6 | 50.5 |
| Black women | 58.4 | 56.2 | 47.4 |
51.8% (-9.5 ppt.)48.8% (-10.6 ppt.)58.3% (-9.2 ppt.)45.5% (-9.9 ppt.)50.5% (-10.2 ppt.)47.4% (-11.0 ppt.)61.3%59.4%67.5%55.4%60.7%58.4%FebruaryMarchAprilAll white workersAll Black workersWhite menWhite womenBlack menBlack women
Note: White refers to non-Hispanic whites, Black refers to Blacks alone. The employment-to-population ratio is the share of the population who are working.
Source: EPI analysis of Bureau of Labor Statistics Current Population Survey public data.
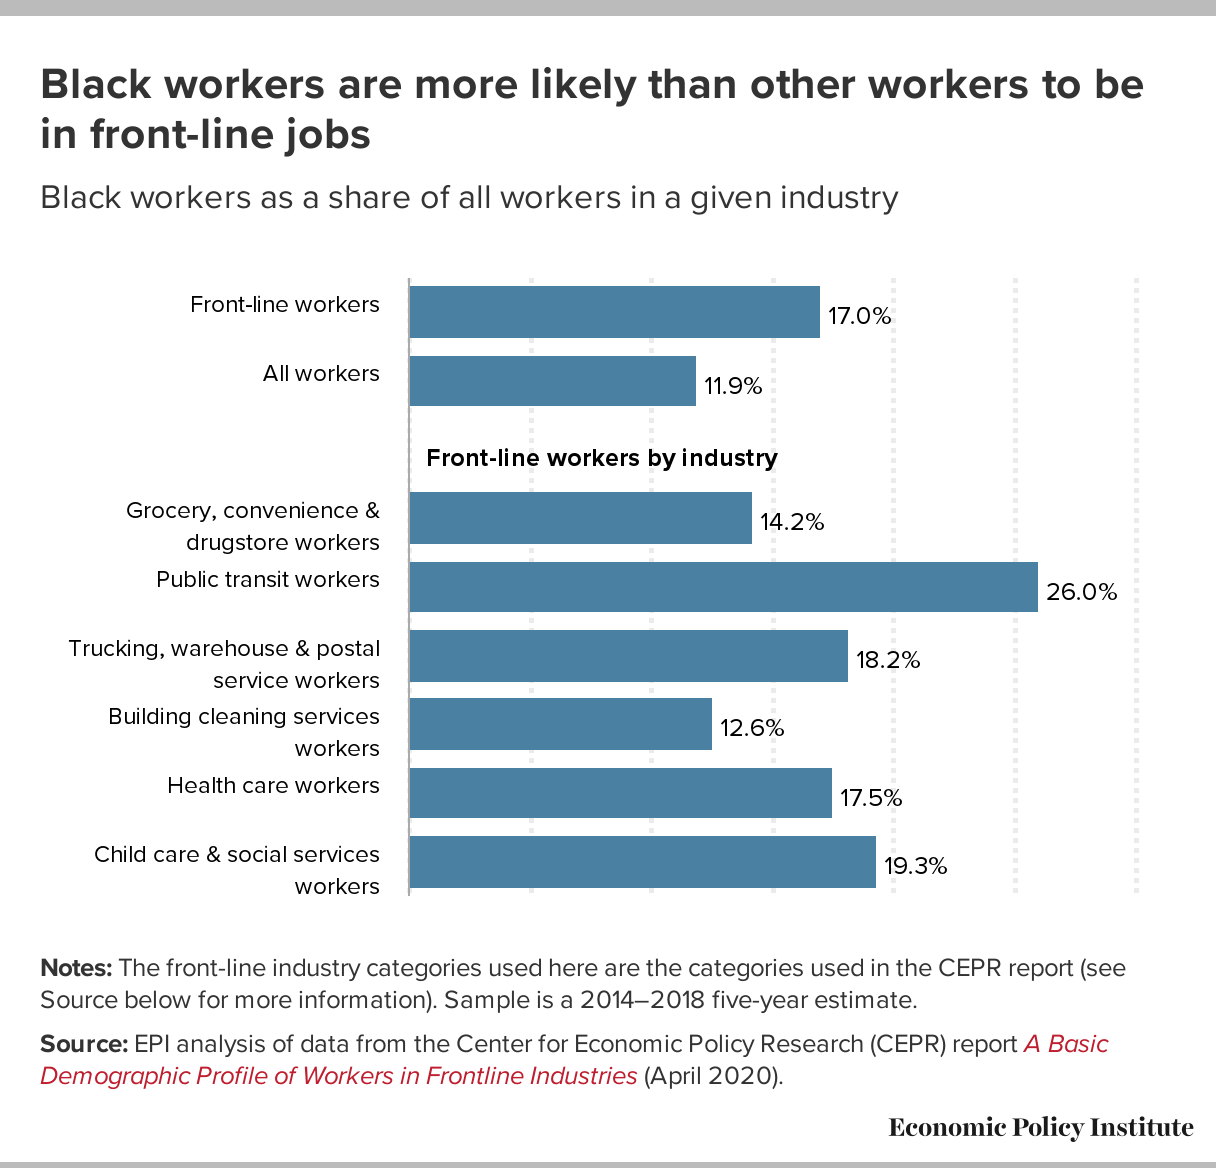
Not only are black workers losing their jobs at an incredible pace, those who aren’t losing their jobs are more likely to be found on the front lines of the economy in essential jobs. Rho, Brown, and Fremstad (2020) conducted an important and useful study of six sectors of the economy that are considered essential and in which most workers are on the front lines of the COVID-19 labor market. Their results, displayed in Figure C, show that black workers make up a disproportionate share of these essential workers who are forced to put themselves and their family members at additional risk of contracting and spreading COVID-19 in order to put food on the table.
Black workers make up about one in nine workers overall; they represent 11.9% of the workforce. However, black workers make up about one in six of all front-line-industry workers. They are disproportionately represented in employment in grocery, convenience, and drug stores (14.2%); public transit (26.0%); trucking, warehouse, and postal service (18.2%); health care (17.5%); and child care and social services (19.3%). While, in the near term, this protects them from job loss, it exposes them to greater likelihood of contracting COVID-19 while performing their jobs.
FIGURE C
| Black workers’ share of workers in the industry | |
|---|---|
| Front-line workers | 17.0% |
| All workers | 11.9% |
| Grocery, convenience & drugstore workers | 14.2% |
| Public transit workers | 26.0% |
| Trucking, warehouse & postal service workers | 18.2% |
| Building cleaning services workers | 12.6% |
| Health care workers | 17.5% |
| Child care & social services workers | 19.3% |
17.0%11.9%14.2%26.0%18.2%12.6%17.5%19.3%Front-line workersAll workersGrocery, convenience &drugstore workersPublic transit workersTrucking, warehouse & postalservice workersBuilding cleaning servicesworkersHealth care workersChild care & social servicesworkersFront-line workers by industry
Notes: The front-line industry categories used here are the categories used in the CEPR report (see Source below for more information). Sample is a 2014–2018 five-year estimate.
Source: EPI analysis of data from the Center for Economic Policy Research (CEPR) report A Basic Demographic Profile of Workers in Frontline Industries (April 2020).
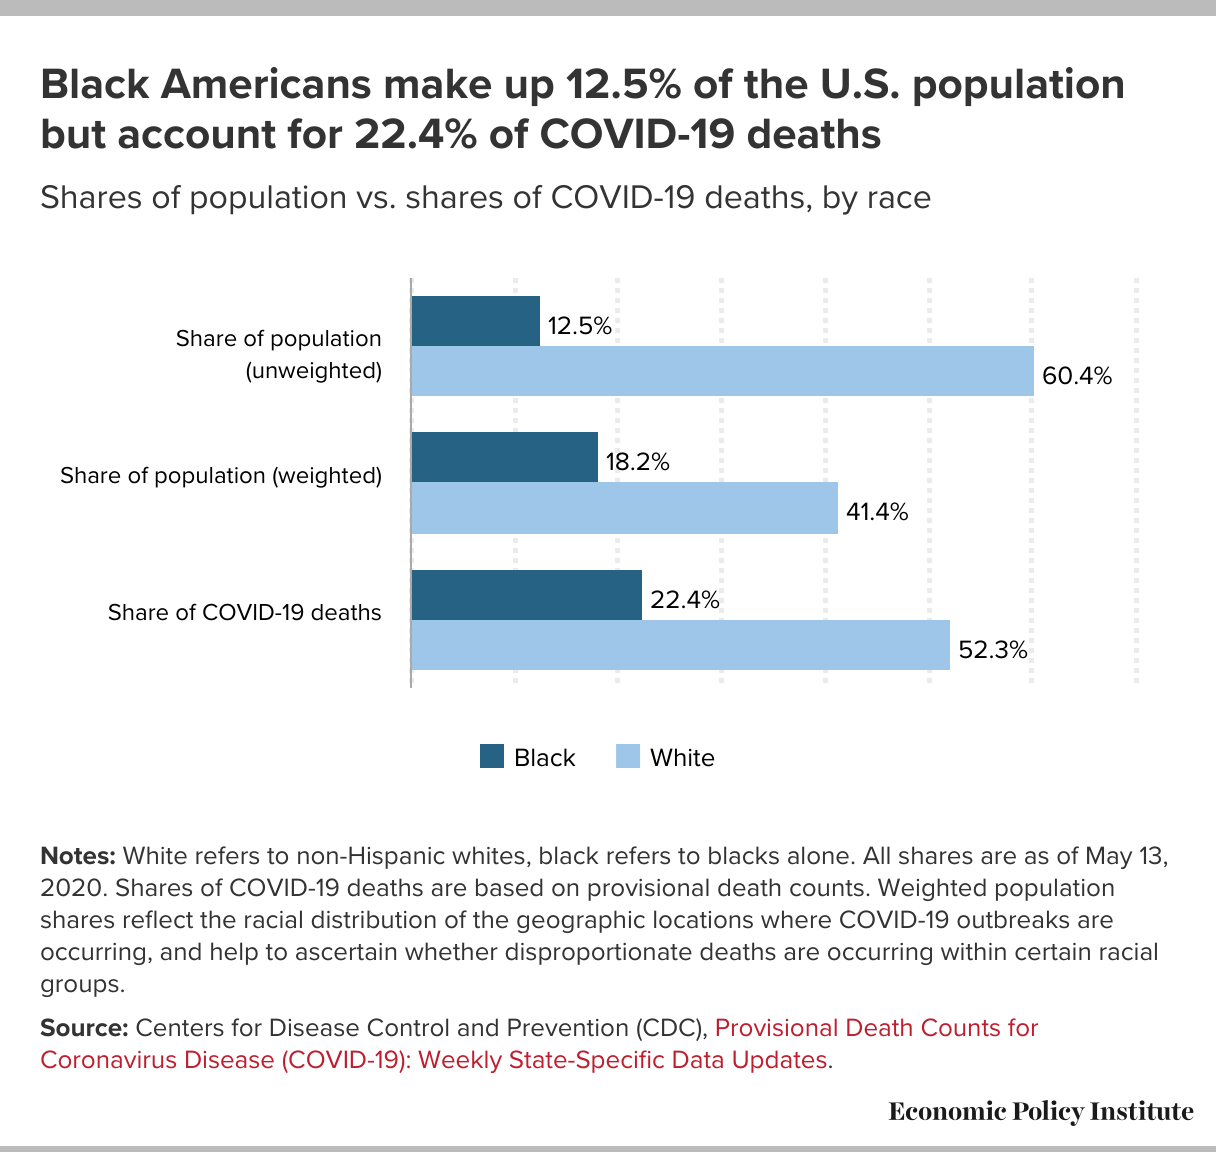
Given the disproportionate representation of black workers in front-line occupations where they face greater risk of exposure to COVID-19, it is not surprising that illness and deaths are disproportionately found among black workers and their families. As shown in Figure D, African Americans’ share of those who have died from COVID-19 nationally is nearly double (1.8 times higher than) their share of the U.S. population. The ratios are even higher in some states: in Wisconsin and Kansas, the rate of African American deaths is more than four times as high as their share of the population in those states (Meepagala and Romer 2020). By comparison, whites account for a smaller share of deaths than their share of the population.
The Centers for Disease Control (CDC) also reports weighted population distributions in an effort to reflect racial/ethnic distributions of the geographic locations where COVID outbreaks are occurring. These weighted population distributions indicate that African Americans represent a larger share of the population in areas where outbreaks are occurring than their representation in the population overall (18.2% compared with 12.5%). Therefore, one of the reasons for disproportionately higher rates of COVID deaths among African Americans is the fact that they are more likely to live in areas that have experienced COVID outbreaks. Even accounting for this fact, African Americans still have higher death rates than their weighted population shares would indicate.
FIGURE D
| Indicator | Black | White |
|---|---|---|
| Share of population (unweighted) | 12.5% | 60.4% |
| Share of population (weighted) | 18.2% | 41.4% |
| Share of COVID-19 deaths | 22.4% | 52.3% |
60.4%41.4%52.3%12.5%18.2%22.4%BlackWhiteShare of population(unweighted)Share of population (weighted)Share of COVID-19 deaths
Notes: White refers to non-Hispanic whites, black refers to blacks alone. All shares are as of May 13, 2020. Shares of COVID-19 deaths are based on provisional death counts. Weighted population shares reflect the racial distribution of the geographic locations where COVID-19 outbreaks are occurring, and help to ascertain whether disproportionate deaths are occurring within certain racial groups.
Source: Centers for Disease Control and Prevention (CDC), Provisional Death Counts for Coronavirus Disease (COVID-19): Weekly State-Specific Data Updates.
The devastating effects of COVID-19 on the economic and physical well-being of black Americans were entirely predictable given persistent economic and health disparities. In this section, we describe some of the underlying economic and health factors behind the unequal outcomes observed thus far. These same factors will ultimately prolong the effects of the pandemic on black workers and their families long after the immediate threat has passed.
Black workers and their families were economically insecure before the pandemic tore through the United States. The pandemic and related job losses have been especially devastating for black households because they have historically suffered from higher unemployment rates, lower wages, lower incomes, and much less savings to fall back on, as well as significantly higher poverty rates than their white counterparts. This prior insecurity has magnified the current economic damage to these workers and their families. The next seven figures illustrate the differences in socioeconomic status between white and black workers, households, and families.
Let’s start with the labor market. Historically, black workers have faced unemployment rates twice as high as those of their white counterparts. When the overall unemployment rate averaged 3.7% in 2019, the white non-Hispanic unemployment rate was 3.0% and the black unemployment rate was twice as high, coming in at an average of 6.1% over the year. This difference cannot be explained away by differences in educational attainment. Figure E shows that at every level of education, the black unemployment rate is significantly higher than the white unemployment rate, even for those workers with college or advanced degrees.
FIGURE E
| Black | White | |
|---|---|---|
| Overall | 6.1% | 3.0% |
| Less than high school | 14.7% | 8.3% |
| High school | 8.3% | 3.9% |
| Some college | 4.9% | 2.9% |
| Bachelor’s degree | 3.4% | 2.2% |
| Advanced degree | 2.3% | 1.7% |
3.0%8.3%3.9%2.9%2.2%1.7%6.1%14.7%8.3%4.9%3.4%2.3%BlackWhiteOverallLess than high schoolHigh schoolSome collegeBachelor’s degreeAdvanced degree
Notes: White refers to non-Hispanic whites, Black refers to Blacks alone. Educational categories are mutually exclusive and represent the highest education level attained for all individuals ages 16 and older.
Source: Economic Policy Institute, State of Working America Data Library, [Unemployment by race and education], 2019.
Among the employed, black workers face significant pay penalties. No matter how you cut the data, black workers face significant pay gaps in the labor market, and research has shown that these pay gaps have grown since 2000 and in the decades before (Gould 2020a; Wilson and Rodgers 2016). On average, black workers are paid 73 cents on the white dollar. We know from a host of economic research that a person’s wages are not a simple function of individual ability. Instead, workers’ ability to claim higher wages rests on a host of social, political, and institutional factors outside their control (Manning 2003; Card, Devicienti, and Maida 2011). Because of historic and current privilege in the labor market (National Advisory Commission on Civil Disorders 2016), white men enjoy exceptionally high wages. Therefore, the gap between white men and black men is particularly stark. Black men are paid only 71 cents on the white male dollar. Black women, who face both gender and race discrimination, are paid even less—64 cents on the white male dollar.
As Figure F shows, black–white wage gaps persist across the wage distribution as well as at different levels of education in the pre-pandemic economy. The black–white wage gap is smallest at the bottom of the wage distribution, where a wage floor—otherwise known as the minimum wage—keeps the lowest-wage black workers from being paid even lower wages. The largest black–white wage gaps are found at the top of the wage distribution and are explained in part by occupational segregation—the underrepresentation of black workers in the highest-wage professions and overrepresentation in lower-wage professions—and the pulling away of the top more generally.
Similarly, across various levels of education, a significant black–white wage gap remains. Black workers can’t simply educate their way out of the gap. Even black workers with an advanced degree experience a significant wage gap compared with their white counterparts.
FIGURE F
| Black | White | |
|---|---|---|
| Overall | $21.05 | $28.66 |
| Men | $20.60 | $29.13 |
| Women | $18.61 | $22.35 |
| 10th | $9.61 | $10.56 |
| Median | $16.12 | $21.32 |
| 95th | $47.94 | $73.38 |
| High school | $16.37 | $20.04 |
| College | $27.81 | $35.90 |
| Advanced degree | $37.33 | $45.29 |
$28.66$29.13$22.35$10.56$21.32$73.38$20.04$35.90$45.29$21.05 (73.4%)$20.60 (70.7%)$18.61 (83.3%)$9.61 (91%)$16.12 (75.6%)$47.94 (65.3%)$16.37 (81.7%)$27.81 (77.5%)$37.33 (82.4%)BlackWhiteOverallMenWomen10thMedian95thHigh schoolCollegeAdvanced degreeBy genderBy wage percentileBy education
Note: White refers to non-Hispanic whites, black refers to blacks alone.
Source: Authors’ analysis of Economic Policy Institute, State of Working America Data Library, [Median/average hourly wages], 2019, and of EPI Current Population Survey Extracts, Version 1.0 (2020), https://microdata.epi.org, adapted from State of Working America Wages 2019.
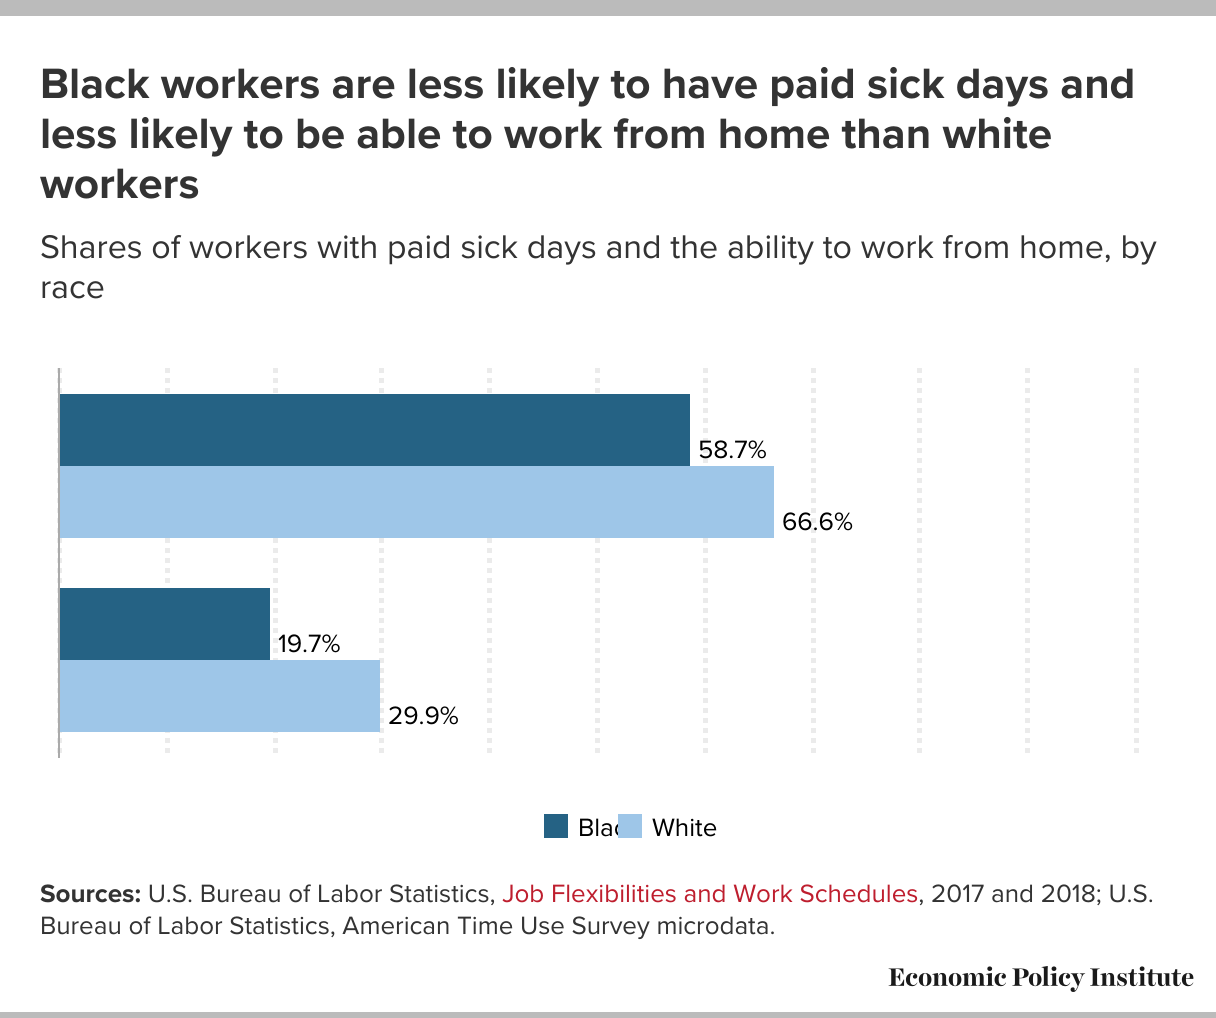
Not only is black worker pay significantly less than that of their white counterparts, but their benefits are as well. Along with health insurance, discussed in more detail below, two benefits are acutely important at this particular time: paid sick days and the ability to work from home. These two workplace benefits help shield workers from economic losses by allowing them to take paid time off to care for themselves or family members and allowing them to stay out of harm’s way and still earn a paycheck by working from home. Figure G illustrates how black workers are less likely than white workers to enjoy these benefits.
The Family First Coronavirus Response Act was an important first step in providing vital paid sick days, but somewhere between 6.8 million and 19.6 million private-sector workers were left without paid sick days as a result of the firm-size exemptions in the law (Gould and Shierholz 2020). Obviously, those loopholes need to be closed, and workers—regardless of race or ethnicity—also need a permanent fix to this basic labor standard.
Given what we know about job losses and essential workers, it’s not surprising that significantly fewer black workers can telework than white workers. Fewer than one in five black workers in the pre-pandemic economy were able to work from home. This inability to keep their jobs and stay safe makes it even harder for black workers to maintain economic and health security during this difficult time.
FIGURE G
| Black | White | |
|---|---|---|
| Paid sick days | 58.7% | 66.6% |
| Could work from home | 19.7% | 29.9% |
66.6%29.9%58.7%19.7%BlackWhitePaid sick daysCould work from home
Sources: U.S. Bureau of Labor Statistics, Job Flexibilities and Work Schedules, 2017 and 2018; U.S. Bureau of Labor Statistics, American Time Use Survey microdata.
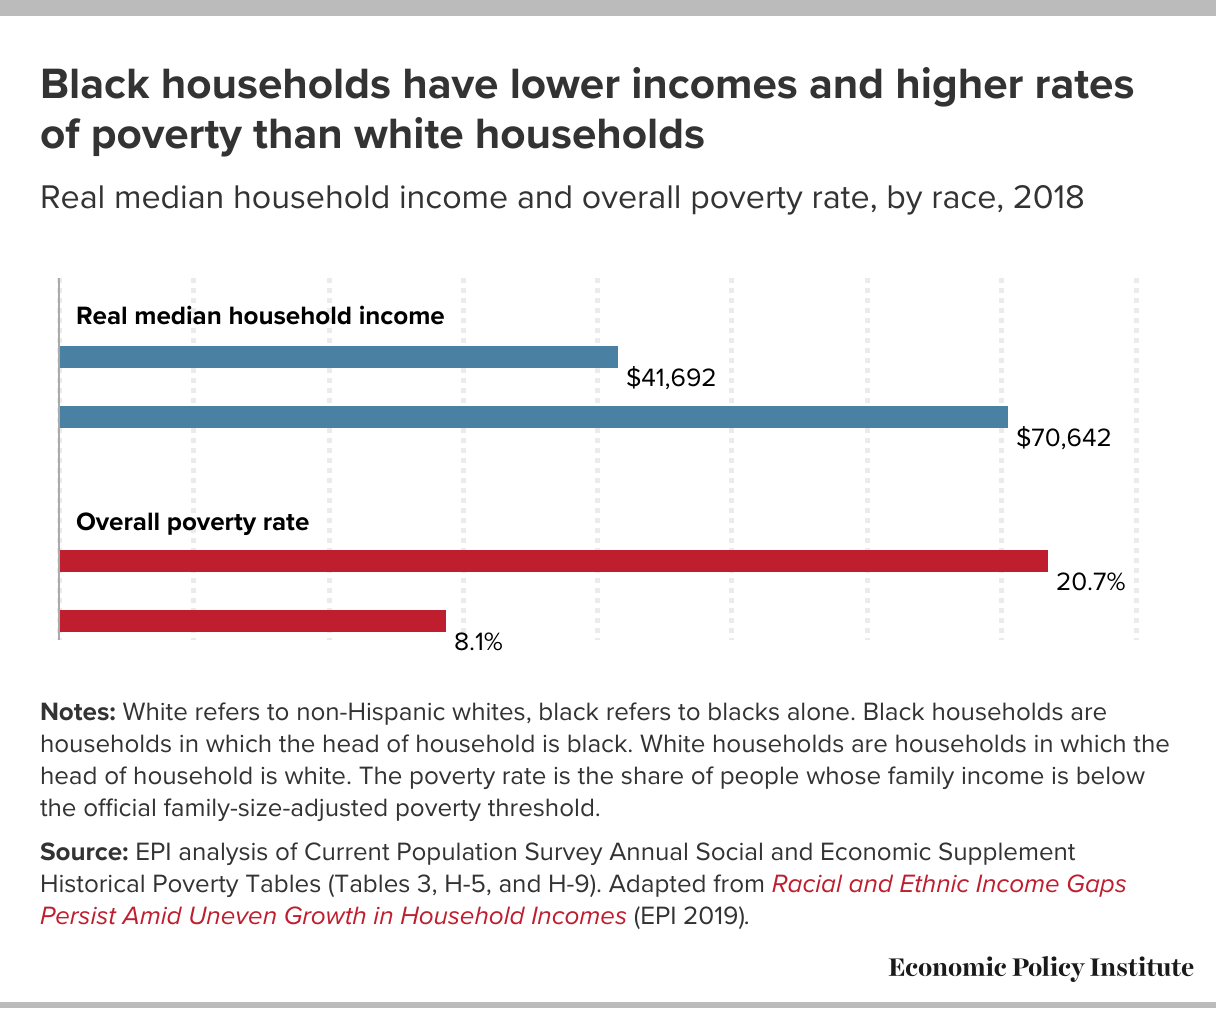
Significant gaps in both employment opportunities and wage levels translate into lower incomes and higher poverty rates in the pre-pandemic economy, as shown in Figure H.
In 2018, median household income for white households was 70% higher than for black households ($70,642 vs. $41,692). On top of decades of preferential wealth accumulation for white families versus black families (Rothstein 2017; Darity et al. 2018), lower incomes are one of the reasons that black families haven’t been able to build up savings to weather storms such as the one our country finds itself in today.
At the bottom of the income distribution, the black poverty rate is two-and-a-half times the white poverty rate. One in five black people in this country live below the poverty line—that’s below about $26,000 annual income for a family of four. Job loss for those living at such low incomes is absolutely shattering.
FIGURE H
| Median household income | Overall poverty rate | |
|---|---|---|
| Black | $41,692 | |
| White | $70,642 | |
| Black | 20.7% | |
| White | 8.1% |
20.7%8.1%$41,692$70,642BlackWhiteBlackWhiteReal median household incomeOverall poverty rate
Notes: White refers to non-Hispanic whites, black refers to blacks alone. Black households are households in which the head of household is black. White households are households in which the head of household is white. The poverty rate is the share of people whose family income is below the official family-size-adjusted poverty threshold.
Source: EPI analysis of Current Population Survey Annual Social and Economic Supplement Historical Poverty Tables (Tables 3, H-5, and H-9). Adapted from Racial and Ethnic Income Gaps Persist Amid Uneven Growth in Household Incomes (EPI 2019).
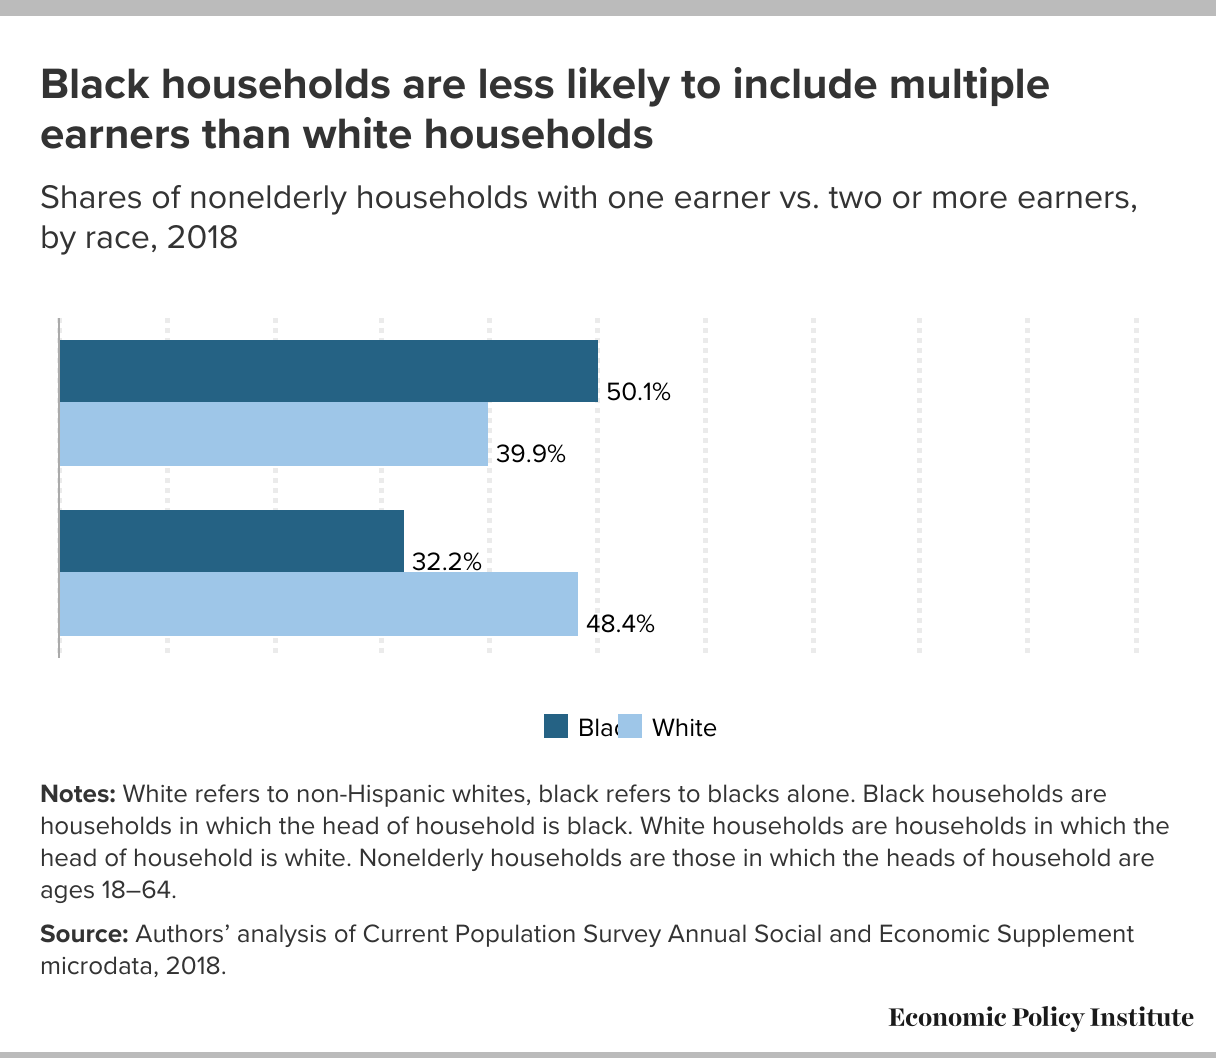
In the pre-pandemic economy, black workers were less likely to have multiple earners in their household (shown in Figure I). Half of all black households had only one earner, while nearly half of all white households had at least two earners. This racial disparity in the number of household earners is not just a function of how many working-age adults live in the household, or family structure, but is another measurable consequence of the persistent 2-to-1 ratio between the black and white unemployment rates. The inequities black workers experience in the labor market have larger consequences for the economic vulnerability of black households because it is far more likely that when one household member loses their job, it translates into a complete loss of income for that household. Black households are less likely to have a second earner to fall back on to make ends meet.
FIGURE I
| Earners in household | Black | White |
|---|---|---|
| One earner | 50.1% | 39.9% |
| Two or more earners | 32.2% | 48.4% |
39.9%48.4%50.1%32.2%BlackWhiteOne earnerTwo or more earners
Notes: White refers to non-Hispanic whites, black refers to blacks alone. Black households are households in which the head of household is black. White households are households in which the head of household is white. Nonelderly households are those in which the heads of household are ages 18–64.
Source: Authors’ analysis of Current Population Survey Annual Social and Economic Supplement microdata, 2018.
Single working parents, a subset of one-earner households, face the added burden of needing to balance the competing demands of work, online distance learning, and child care responsibilities. Black women, in particular, as shown in Figure J, find themselves at the nexus of these overlapping responsibilities since they are 3.6 times as likely as white women to be single heads of households with children under age 18 (14.4% of black households compared with 4.0% of white households).
FIGURE J
| Black | White | |
|---|---|---|
| Married couple family | 27.1% | 51.2% |
| Married couple family with minor children | 10.6% | 17.4% |
| Single female householder family | 26.4% | 8.6% |
| Single female householder family with minor children | 14.4% | 4.0% |
51.2%17.4%8.6%4.0%27.1%10.6%26.4%14.4%BlackWhiteMarried couple familyMarried couple family withminor childrenSingle female householderfamilySingle female householderfamily with minor children
Note: White refers to non-Hispanic whites, Black refers to Blacks alone. Black households are households in which the head of household is Black. White households are households in which the head of household is white.
Source: U.S. Census Bureau, 2018 American Community Survey 1-Year Estimates, Table S0201.
On top of lower wages and incomes and higher poverty rates, black families have significantly less access to liquid assets than white families. It’s been long established that black families face a large and persistent wealth gap. Darity and others have shown that no matter how it’s measured, the racial wealth gap is large and persistent (Darity et al. 2018). To weather a financial loss, families often must dip into their liquid assets to pay for their living expenses. If they lose their job or experience a serious health shock, their only hope of making ends meet and continuing to pay their rent or mortgage and put food on the table is to rely on their savings. Wealth is often tied up in housing assets, particularly for black families, and therefore is inaccessible when dealing with sudden and large losses in income.
Figure K displays one component of wealth, the total value of all transaction accounts for black and white families. Transaction accounts include checking or savings accounts, cash, prepaid cards, and directly held stocks, bonds, and mutual funds. These are assets that can quickly be used to purchase goods and services, unlike less liquid sources of wealth like homeownership or assets in 401(k)s. Overall, white families hold, on average, more than five times as much liquid assets as black families do, $49,529 versus $8,762. This makes white families far more capable of weathering the storm of COVID-19, whether it be job loss or another financial hit.
The attainment of higher education does not bridge this divide. This gap remains large when we compare white and black families whose heads of household have the same level of education. In fact, the absolute gap in liquid assets between black and white families is far larger among those with a college degree or more versus those with less than a college degree. White families headed by a college-degree holder have nearly five times the access to money in transaction accounts as similarly degreed black families. The gap persists whether the black family owns a home or not. The gaps in liquid assets differ by what sector the family head works in, but no matter how the data are cut, white families have far more access to liquid wealth.
Load older comments...
Loading comments...
You've Been Timed Out
Please login to continue